
Have you ever wanted your dynamic analysis tool to take as long as GTA V to query memory regions while being impossible to kill and using 100% of the poor CPU core that encountered this? Well, me neither, but the technology is here and it’s quite simple!
What, Where, WTF?
As usual with my anti-debug related posts, everything starts with a little innocuous flag that Microsoft hasn’t documented. Or at least so I thought.
This time the main offender is NtMapViewOfSection, a syscall that can map a section object into the address space of a given process, mainly used for implementing shared memory and memory mapping files (The Win32 API for this would be MapViewOfFile).
NTSTATUS NtMapViewOfSection(
  HANDLE          SectionHandle,
  HANDLE          ProcessHandle,
  PVOID           *BaseAddress,
  ULONG_PTR       ZeroBits,
  SIZE_T          CommitSize,
  PLARGE_INTEGER  SectionOffset,
  PSIZE_T         ViewSize,
  SECTION_INHERIT InheritDisposition,
  ULONG           AllocationType,
  ULONG           Win32Protect);
By doing a little bit of digging around in ntoskrnl’s MiMapViewOfSection and searching in the Windows headers for known constants, we can recover the meaning behind most valid flag values.
/* Valid values for AllocationType */
MEM_RESERVE                0x00002000
SEC_PARTITION_OWNER_HANDLE 0x00040000
MEM_TOPDOWN                0x00100000
SEC_NO_CHANGE              0x00400000
SEC_FILE                   0x00800000
MEM_LARGE_PAGES            0x20000000
SEC_WRITECOMBINE           0x40000000
Initially I failed at ctrl+f and didn’t realize that 0x2000 is a known flag, so I started digging deeper. In the same function we can also discover what the flag does and its main limitations.
// --- MAIN FUNCTIONALITY ---
if (SectionOffset + ViewSize > SectionObject->SizeOfSection &&
    !(AllocationAttributes & 0x2000))
    return STATUS_INVALID_VIEW_SIZE;

// --- LIMITATIONS ---
// Image sections are not allowed
if ((AllocationAttributes & 0x2000) &&
    SectionObject->u.Flags.Image)
    return STATUS_INVALID_PARAMETER;

// Section must have been created with one of these 2 protection values
if ((AllocationAttributes & 0x2000) &&
    !(SectionObject->InitialPageProtection & (PAGE_READWRITE | PAGE_EXECUTE_READWRITE)))
    return STATUS_SECTION_PROTECTION;

// Physical memory sections are not allowed
if ((Params->AllocationAttributes & 0x20002000) &&
    SectionObject->u.Flags.PhysicalMemory)
    return STATUS_INVALID_PARAMETER;
Now, this sounds like a bog standard MEM_RESERVE and it’s possible to VirtualAlloc(MEM_RESERVE) whatever you want as well, however APIs that interact with this memory do treat it differently.
How differently you may ask? Well, after incorrectly identifying the flag as undocumented, I went ahead and attempted to create the biggest section I possibly could. Everything went well until I opened the ProcessHacker memory view. The PC was nigh unusable for at least a minute and after that process hacker remained unresponsive for a while as well. Subsequent runs didn’t seem to seize up the whole system however it still took up to 4 minutes for the NtQueryVirtualMemory call to return.
I guess you could call this a happy little accident as Bob Ross would say.
The cause
Since I’m lazy, instead of diving in and reversing, I decided to use Windows Performance Recorder. It’s a nifty tool that uses ETW tracing to give you a lot of insight into what was happening on the system. The recorded trace can then be viewed in Windows Performance Analyzer.
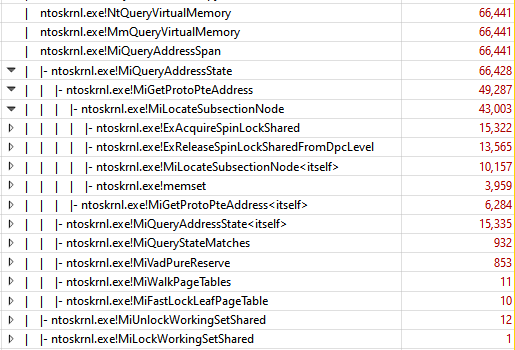
This doesn’t say too much, but at least we know where to look.
After spending some more time staring at the code in everyone’s favourite decompiler it became a bit more clear what’s happening. I’d bet that it’s iterating through every single page table entry for the given memory range. And because we’re dealing with terabytes of of data at a time it’s over a billion iterations. (MiQueryAddressState is a large function, and I didn’t think a short pseudocode snippet would do it justice)
This is also reinforced by the fact that from my testing the relation between view size and time taken is completely linear. To further verify this idea we can also do some quick napkin math to see if it all adds up:
instructions per second (ips) = 3.8Ghz * ~8
page table entries      (n)   = 12TB / 4096
time taken              (t)   = 3.5 minutes

instruction per page table entry = ips * t / n = ~2000
In my opinion, this number looks rather believable so, with everything added up, I’ll roll with the current idea.
Minimal Example
// file handle must be a handle to a non empty file
void* section = nullptr;
auto status = NtCreateSection(§ion,
MAXIMUM_ALLOWED,
nullptr,
nullptr,
PAGE_EXECUTE_READWRITE,
SEC_COMMIT,
file_handle);
if (!NT_SUCCESS(status))
return status;
// Personally largest I could get the section was 12TB, but I'm sure people with more
// memory could get it larger.
void* base = nullptr;
for (size_t i = 46; i > 38; --i) {
SIZE_T view_size = (1ull << i);
status = NtMapViewOfSection(section,
NtCurrentProcess(),
&base,
0,
0x1000,
nullptr,
&view_size,
ViewUnmap,
0x2000, // <- the flag
PAGE_EXECUTE_READWRITE);
if (NT_SUCCESS(status))
break;
}
Do note that, ideally, you’d need to surround code with these sections because only the reserved portions of these sections cause the slowdown. Furthermore, transactions could also be a solution for needing a non-empty file without touching anything already existing or creating something visible to the user.
Conclusion
I think this is a great and powerful technique to mess with people analyzing your code. The resource usage is reasonable, all it takes to set it up is a few syscalls, and it’s unlikely to get accidentally triggered.