Today, we will be looking at the “Connected User Experiences and Telemetry service,” also known as “diagtrack.” This article is quite heavy on NTFS-related terminology, so you’ll need to have a good understanding of it.
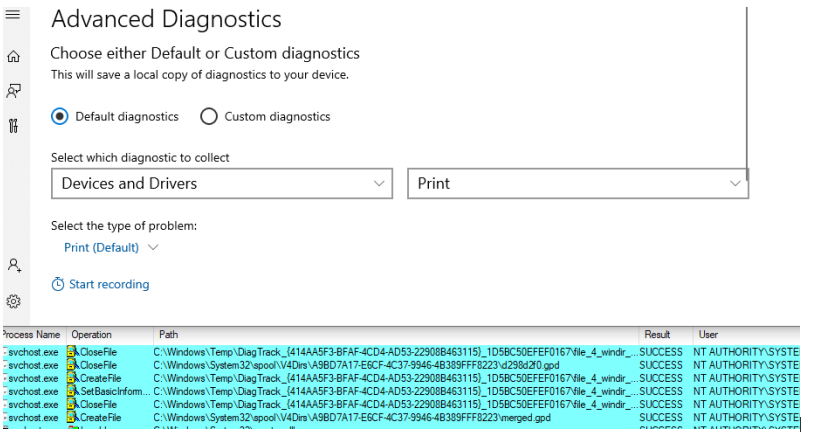
A feature known as “Advanced Diagnostics” in the Feedback Hub caught my interest. It is triggerable by all users and causes file activity in C:\Windows\Temp, a directory that is writeable for all users.

Reverse engineering the functionality and duplicating the needed interactions was quite a challenge as it used WinRT IPC instead of COM and I did not know WinRT existed, so I had some catching up to do.
In C:\Program Files\WindowsApps\Microsoft.WindowsFeedbackHub_1.2003.1312.0_x64__8wekyb3d8bbwe\Helper.dll, I found a function with surprising possibilities:
WINRT_IMPL_AUTO(void) StartCustomTrace(param::hstring const& customTraceProfile) const;
This function will execute a WindowsPerformanceRecorder profile defined in an XML file specified as an argument in the security context of the Diagtrack Service.
The file path is parsed relative to the System32 folder, so I dropped an XML file in the writeable-for-all directory System32\Spool\Drivers\Color and passed that file path relative to the system directory aforementioned and voila - a trace recording was started by Diagtrack!
If we look at a minimal WindowsPerformanceRecorder profile we’d see something like this:
<WindowsPerformanceRecorder Version="1">
 <Profiles>
  <SystemCollector Id="SystemCollector">
   <BufferSize Value="256" />
   <Buffers Value="4" PercentageOfTotalMemory="true" MaximumBufferSpace="128" />
  </SystemCollector>
  <EventCollector Id="EventCollector_DiagTrack_1e6a" Name="DiagTrack_1e6a_0">
   <BufferSize Value="256" />
   <Buffers Value="0.9" PercentageOfTotalMemory="true" MaximumBufferSpace="4" />
  </EventCollector>
   <SystemProvider Id="SystemProvider" />
  <Profile Id="Performance_Desktop.Verbose.Memory" Name="Performance_Desktop"
     Description="exploit" LoggingMode="File" DetailLevel="Verbose">
   <Collectors>
    <SystemCollectorId Value="SystemCollector">
     <SystemProviderId Value="SystemProvider" />
    </SystemCollectorId>
    <EventCollectorId Value="EventCollector_DiagTrack_1e6a">
     <EventProviders>
      <EventProviderId Value="EventProvider_d1d93ef7" />
     </EventProviders>
    </EventCollectorId>
    </Collectors>
  </Profile>
 </Profiles>
</WindowsPerformanceRecorder>
Information Disclosure
Having full control of the file opens some possibilities. The name attribute of the EventCollector element is used to create the filename of the recorded trace. The file path becomes:
C:\Windows\Temp\DiagTrack_alternativeTrace\WPR_initiated_DiagTrackAlternativeLogger_DiagTrack_XXXXXX.etl (where XXXXXX is the value of the name attribute.)
Full control over the filename and path is easily gained by setting the name to: \..\..\file.txt: which becomes the below:
C:\Windows\Temp\DiagTrack_alternativeTrace\WPR_initiated_DiagTrackAlternativeLogger_DiagTrack\..\..\file.txt:.etl
This results in C:\Windows\Temp\file.txt being used.
The recorded traces are opened by SYSTEM with FILE_OVERWRITE_IF as disposition, so it is possible to overwrite any file writeable by SYSTEM. The creation of files and directories (by appending ::$INDEX_ALLOCATION) in locations writeable by SYSTEM is also possible.
The ability to select any ETW provider for traces executed by the service is also interesting from an information disclosure point of view.
One scenario where I could see myself using the data is when you don’t know a filename because a service creates a file in a folder where you do not have permission to list the files.
Such filenames can get leaked by Microsoft-Windows-Kernel-File provider as shown in this snippet from an etl file recorded by adding 22FB2CD6-0E7B-422B-A0C7-2FAD1FD0E716 to the WindowsPerformanceRecorder profile file.
<EventData>
 <Data Name="Irp">0xFFFF81828C6AC858</Data>
 <Data Name="FileObject">0xFFFF81828C85E760</Data>
 <Data Name="IssuingThreadId">  10096</Data>
 <Data Name="CreateOptions">0x1000020</Data>
 <Data Name="CreateAttributes">0x0</Data>
 <Data Name="ShareAccess">0x3</Data>
 <Data Name="FileName">\Device\HarddiskVolume2\Users\jonas\OneDrive\Dokumenter\FeedbackHub\DiagnosticLogs\Install and Update-Post-update app experience\2019-12-13T05.42.15-SingleEscalations_132206860759206518\file_14_ProgramData_USOShared_Logs__</Data>
</EventData>
Such leakage can yield exploitation possibility from seemingly unexploitable scenarios.
Other security bypassing providers:
Microsoft-Windows-USB-UCX {36DA592D-E43A-4E28-AF6F-4BC57C5A11E8}Microsoft-Windows-USB-USBPORT {C88A4EF5-D048-4013-9408-E04B7DB2814A}(Raw USB data is captured, enabling keyboard logging)Microsoft-Windows-WinINet {43D1A55C-76D6-4F7E-995C-64C711E5CAFE}Microsoft-Windows-WinINet-Capture {A70FF94F-570B-4979-BA5C-E59C9FEAB61B}(Raw HTTP traffic from iexplore, Microsoft Store, etc. is captured - SSL streams get captured pre-encryption.)Microsoft-PEF-WFP-MessageProvider(IPSEC VPN data pre encryption)
Code Execution
Enough about information disclosure, how do we turn this into code execution?
The ability to control the destination of .etl files will most likely not lead to code execution easily; finding another entry point is probably necessary. The limited control over the files content makes exploitation very hard; perhaps crafting an executable PowerShell script or bat file is plausible, but then there is the problem of getting those executed.
Instead, I chose to combine my active trace recording with a call to:
WINRT_IMPL_AUTO(Windows::Foundation::IAsyncAction) SnapCustomTraceAsync(param::hstring const& outputDirectory)
When supplying an outputDirectory value located inside %WINDIR%\temp\DiagTrack_alternativeTrace (Where the .etl files of my running trace are saved) an interesting behavior emerges.
The Diagtrack Service will rename all the created .etl files in DiagTrack_alternativeTrace to the directory given as the outputDirectory argument to SnapCustomTraceAsync. This allows destination control to be acquired because rename operations that occur where the source file gets created in a folder that grants non-privileged users write access are exploitable. This is due to the permission inheritance of files and their parent directories. When a file is moved by a rename operation, the DACL does not change. What this means is that if we can make the destination become %WINDIR%\System32, and somehow move the file then we will still have write permission to the file. So, we know we control the outputDirectory argument of SnapCustomTraceAsync, but some limitations exist.
If the chosen outputDirectory is not a child of %WINDIR%\temp\DiagTrack_alternativeTrace, the rename will not happen. The outputDirectory cannot exist because the Diagtrack Service has to create it. When created, it is created with SYSTEM as its owner; only the READ permission is granted to users.
This is problematic as we cannot make the directory into a mount point. Even if we had the required permissions, we would be stopped by not being able to empty the directory because Diagtrack has placed the snapshot output etl file inside it. Lucky for us, we can circumvent these obstacles by creating two levels of indirection between the outputDirectory destination and DiagTrack_alternativeTrace.
By creating the folder DiagTrack_alternativeTrace\extra\indirections and supplying %WINDIR%\temp\DiagTrack_alternativeTrace\extra\indirections\snap as the outputDirectory we allow Diagtrack to create the snap folder with its limited permissions, as we are inside DiagTrack_alternativeTrace. With this, we can rename the extra folder, as it is created by us. The two levels of indirection is necessary to bypass the locking of the directory due to Diagtrack having open files inside the directory. When extra is renamed, we can recreate %WINDIR%\temp\DiagTrack_alternativeTrace\extra\indirections\snap (which is now empty) and we have full permissions to it as we are the owner!
Now, we can turn DiagTrack_alternativeTrace\extra\indirections\snap into a mount point targeted at %WINDIR%\system32 and Diagtrack will move all files matching WPR_initiated_DiagTrack*.etl* into %WINDIR%\system32. The files will still be writeable as they were created in a folder that granted users permission to WRITE. Unfortunately, having full control over a file in System32 is not quite enough for code execution… that is, unless we have a way of executing user controllable filenames - like the DiagnosticHub plugin method popularized by James Forshaw. There’s a caveat though, DiagnosticHub now requires any DLL it loads to be signed by Microsoft, but we do have some ways to execute a DLL file in system32 under SYSTEM security context - if the filename is something specific. Another snag though is that the filename is not controllable. So, how can we take control?
If instead of making the mountpoint target System32, we target an Object Directory in the NT namespace and create a symbolic link with the same name as the rename destination file, we gain control over the filename. The target of the symbolic link will become the rename operations destination. For instance, setting it to\??\%WINDIR%\system32\phoneinfo.dll results in write permission to a file the Error Reporting service will load and execute when an error report is submitted out of process. For my mountpoint target I chose \RPC Control as it allows all users to create symbolic links inside.
Let’s try it!
When Diagtrack should have done the rename, nothing happened. This is because, before the rename operation is done, the destination folder is opened, but now is an object directory. This means it’s unable to be opened by the file/directory API calls. This can be circumvented by timing the creation of the mount point to be after the opening of the folder, but before the rename. Normally in such situations, I create a file in the destination folder with the same name as the rename destination file. Then I put an oplock on the file, and when the lock breaks I know the folder check is done and the rename operation is about to begin. Before I release the lock I move the file to another folder and set the mount point on the now empty folder. That trick would not work this time though as the rename operation was configured to not overwrite an already existing file. This also means the rename would abort because of the existing file - without triggering the oplock.
On the verge of giving up I realized something:
If I make the junction point switch target between a benign folder and the object directory every millisecond there is 50% chance of getting the benign directory when the folder check is done and 50% chance of getting the object directory when the rename happens. That gives 25% chance for a rename to validate the check but end up as phoneinfo.dll in System32. I try avoiding race conditions if possible, but in this situation there did not appear to be any other ways forward and I could compensate for the chance of failure by repeating the process. To adjust for the probability of failure I decided to trigger an arbitrary number of renames, and fortunately for us, there’s a detail about the flow that made it possible to trigger as many renames I wanted in the same recording. The renames are not linked to files the diagnostic service knows it has created, so the only requirement is that they are in %WINDIR%\temp\DiagTrack_alternativeTrace and match WPR_initiated_DiagTrack*.etl*
Since we have permission to create files in the target folder, we can now create WPR_initiated_DiagTrack0.etl, WPR_initiated_DiagTrack1.etl, etc. and they will all get renamed!
As the goal is one of the files ending up as phoneinfo.dll in System32, why not just create the files as hard links to the intended payload? This way there is no need to use the WRITE permission to overwrite the file after the move.
After some experimentation I came to the following solution:
- Create the folders
%WINDIR%\temp\DiagTrack_alternativeTrace\extra\indirections Start diagnostic trace
%WINDIR%\temp\DiagTrack_alternativeTrace\WPR_initiated_DiagTrackAlternativeLogger_WPR System Collector.etlis created
- Create
%WINDIR%\temp\DiagTrack_alternativeTrace\WPR_initiated_DiagTrack[0-100].etlas hardlinks to the payload. - Create symbolic links
\RPC Control\WPR_initiated_DiagTrack[0-100.]etltargeting%WINDIR%\system32\phoneinfo.dll - Make OPLOCK on
WPR_initiated_DiagTrack100.etl; when broken, check if%WINDIR%\system32\phoneinfo.dllexists. If not, repeat creation ofWPR_initiated_DiagTrack[].etlfiles and matching symbolic links. - Make OPLOCK on on
WPR_initiated_DiagTrack0.etl; when it is broken, we know that the rename flow has begun but the first rename operation has not happened yet.
Upon breakage:
- rename
%WINDIR%\temp\DiagTrack_alternativeTrace\extrato%WINDIR%\temp\DiagTrack_alternativeTrace\{RANDOM-GUID} - Create folders
%WINDIR%\temp\DiagTrack_alternativeTrace\extra\indirections\snap - Start thread that in a loop switches
%WINDIR%\temp\DiagTrack_alternativeTrace\extra\indirections\snapbetween being a mountpoint targeting%WINDIR%\temp\DiagTrack_alternativeTrace\extraand\RPC Controlin NT object namespace. - Start snapshot trace with
%WINDIR%\temp\DiagTrack_alternativeTrace\extra\indirections\snapasoutputDirectory
Upon execution, 100 files will get renamed. If none of them becomes phoneinfo.dll in system32, it will repeat until success.
I then added a check for the existence of %WINDIR%\system32\phoneinfo.dll in the thread that switches the junction point. The increased delay between switching appeared to increase the chance of one of the renames creating phoneinfo.dll. Testing shows the loop ends by the end of the first 100 iterations.
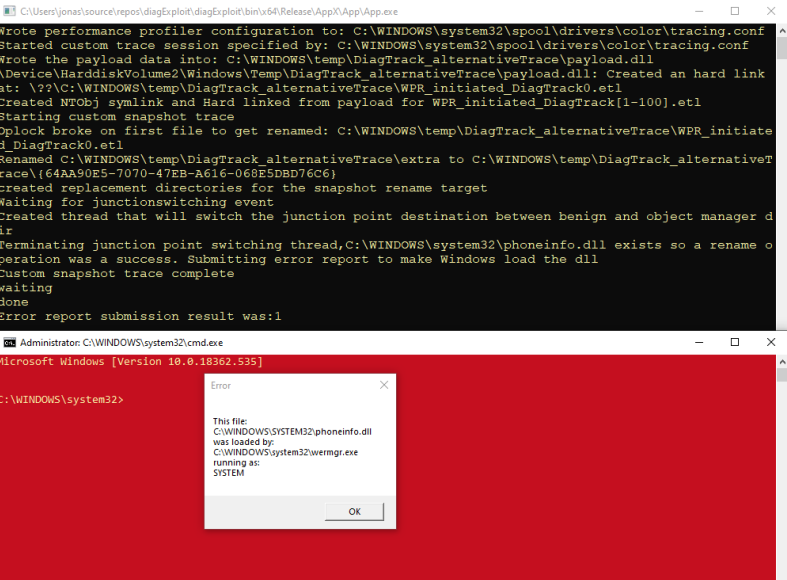
Upon detection of %WINDIR%\system32\phoneinfo.dll, a blank error report is submitted to Windows Error Reporting service, configured to be submitted out of proc, causing wermgmr.exe to load the just created phoneinfo.dll in SYSTEM security context.
The payload is a DLL that upon DLL_PROCESS_ATTACH will check for SeImpersonatePrivilege and, if enabled, cmd.exe will get spawned on the current active desktop. Without the privileged check, additional command prompts would spawn since phoneinfo.dll is also attempted to be loaded by the process that initiates the error reporting.
In addition, a message is shown using WTSSendMessage so we get an indicator of success even if the command prompt cannot be spawned in the correct session/desktop.

The red color is because my command prompts auto execute echo test> C:\windows:stream && color 4E; that makes all UAC elevated command prompts’ background color RED as an indicator to me.
Though my example on the repository contains private libraries, it may still be beneficial to get a general overview of how it works.
